How do I get a CAD file of my property?
Public agencies publish parcel maps, GIS layers and scanned records, but not a CAD file of your lot. AEC First Phase compiles those public pieces — parcel geometry, building footprints, lidar contours, aerials and the recorded maps — into one DXF for a Los Angeles County property, on State Plane coordinates. It is a tentative base drawing, not a survey.
The sample project’s drawing, 1635 Woods Dr
- File
- DXF, AutoCAD 2000 format
- Coordinates
- State Plane California Zone 5, US survey feet (EPSG:2229)
- Layers
- 37 that hold something
- Price
- $5 unlocks the property’s whole package
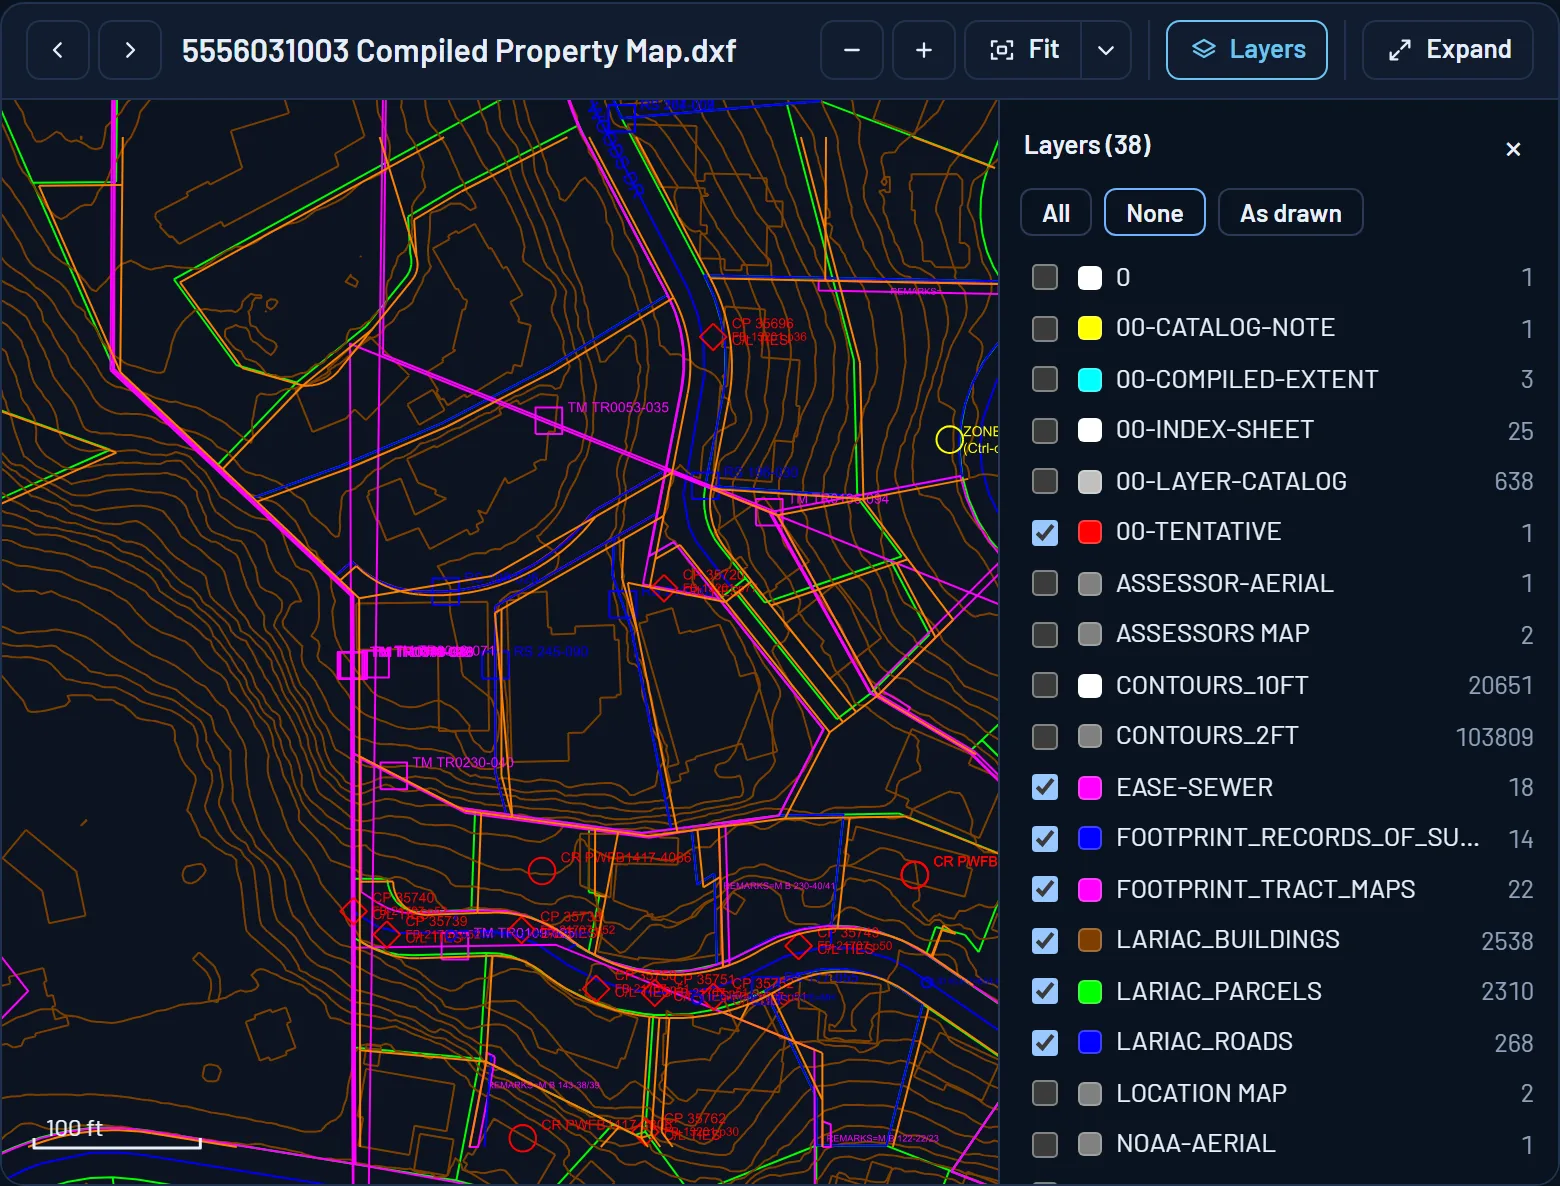
- Lot linesThe neighboring parcels, from the county’s parcel geometry.
- Building footprintsFrom the regional aerial survey.
- Tract map outlinesThe extent of each recorded tract map, in magenta.
- Record nodesOne per record of survey or tract map, each a hyperlink to the agency’s document.
- Corner recordsAt the monuments they describe.
- City control pointsWith the field-book reference beside each.
- ZoningThe zone label, linked to the City’s zoning page.
- LayersEverything is on its own layer. Switch them in the viewer or in your own CAD program.
The sample project’s compiled drawing in the package viewer, with the aerial and map underlays switched off and the index contours on.
What public data can give you
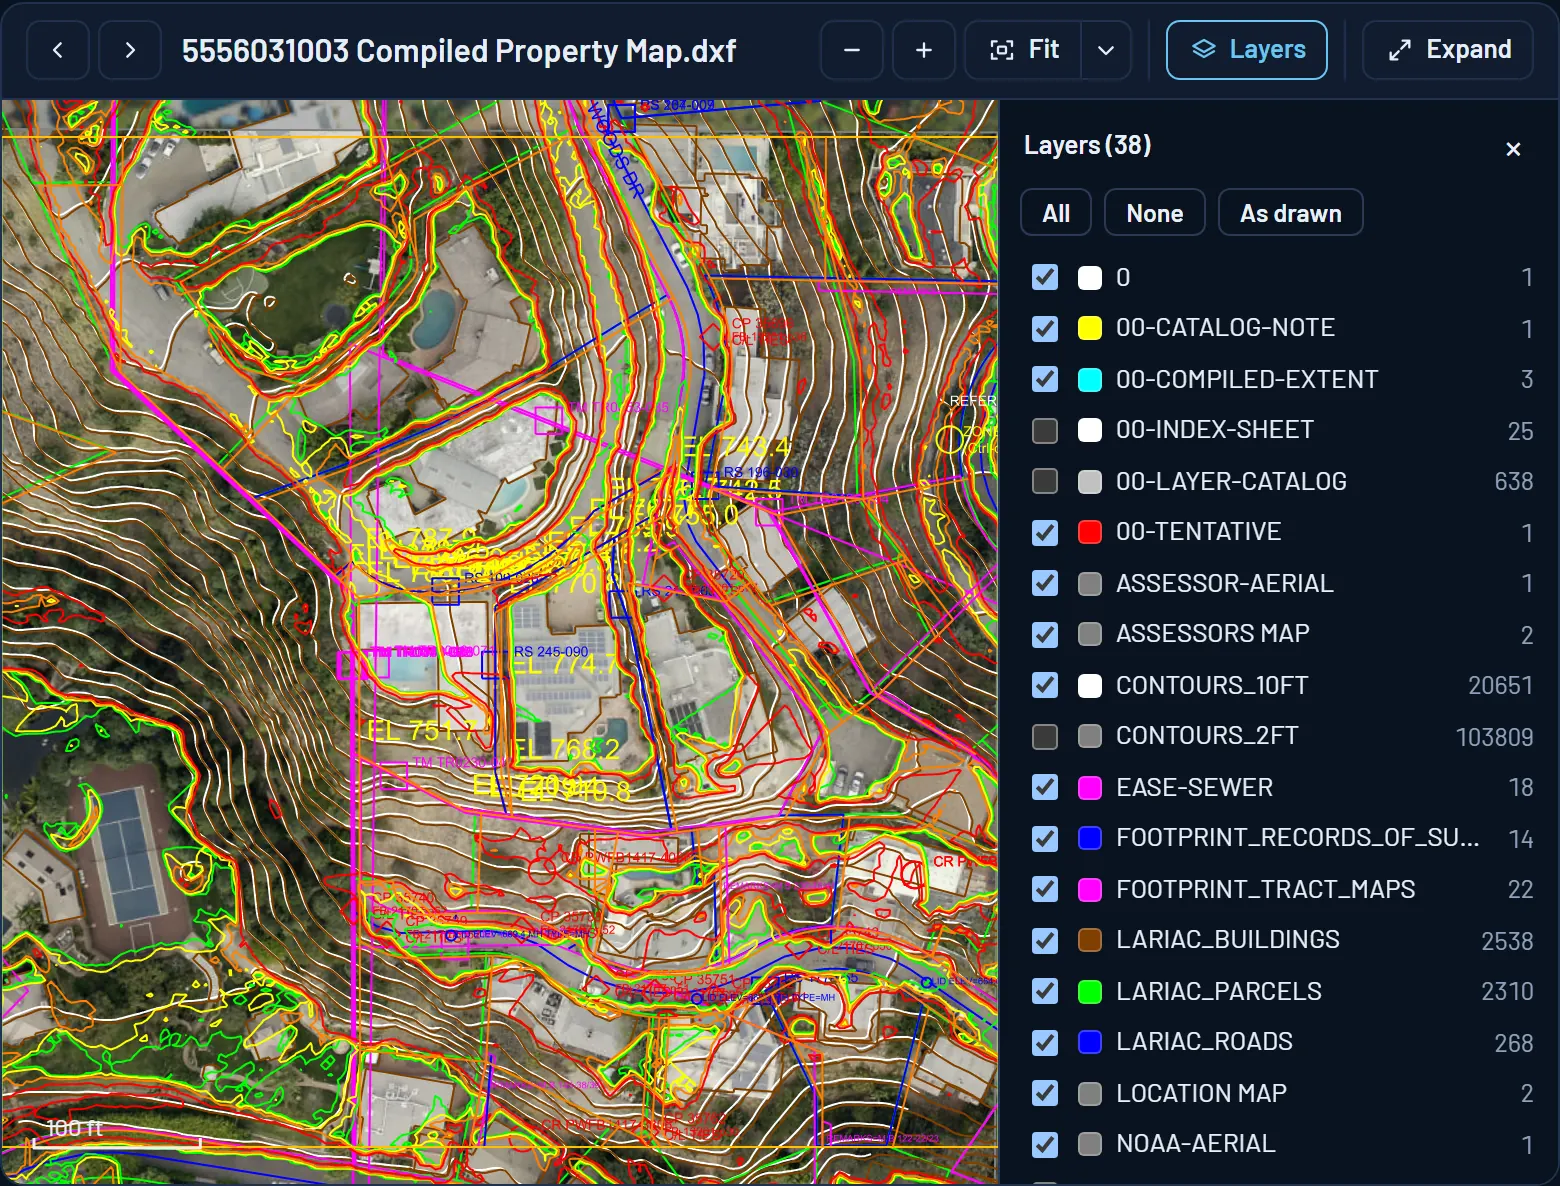
Everything in the drawing comes from a public source and sits where that source puts it. The lot lines are the county’s parcel geometry — the same lines the assessor’s map and every map app draw. Building footprints come from the regional aerial survey. The 1-foot contours and spot elevations are generated from public lidar. The aerial photographs are placed as underlays on the same coordinates. Each record of survey, tract map and corner record found near the lot is drawn as an outline or a node, hyperlinked to the agency’s document.
Inside the City of Los Angeles the drawing also carries the City’s sewer, easement and right-of-way layers, where the City’s map service publishes them. The file is a DXF on State Plane California Zone 5, in US survey feet, so it opens to scale in any CAD program.
What it cannot give you
A drawing compiled from public records is accurate, not precise. County parcel lines are drawn for assessment and mapping, not measured on the ground; they are not the boundary a land surveyor would establish, and they can be off. The drawing sets no boundary, shows no easement that is not in a published layer, and locates no building, wall or utility by measurement.
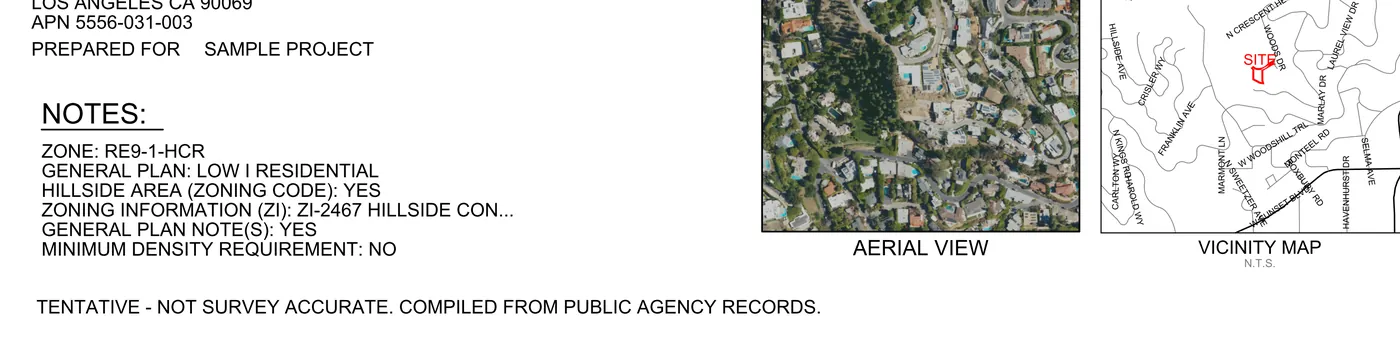
The drawing carries the note “Tentative – not survey grade”, and every printed sheet carries “Tentative – not survey accurate. Compiled from public agency records.”
Use it as the first base for concepts, feasibility and estimates. Replace it with a survey before design development, and before anything is built to a line.
The layers in the compiled drawing
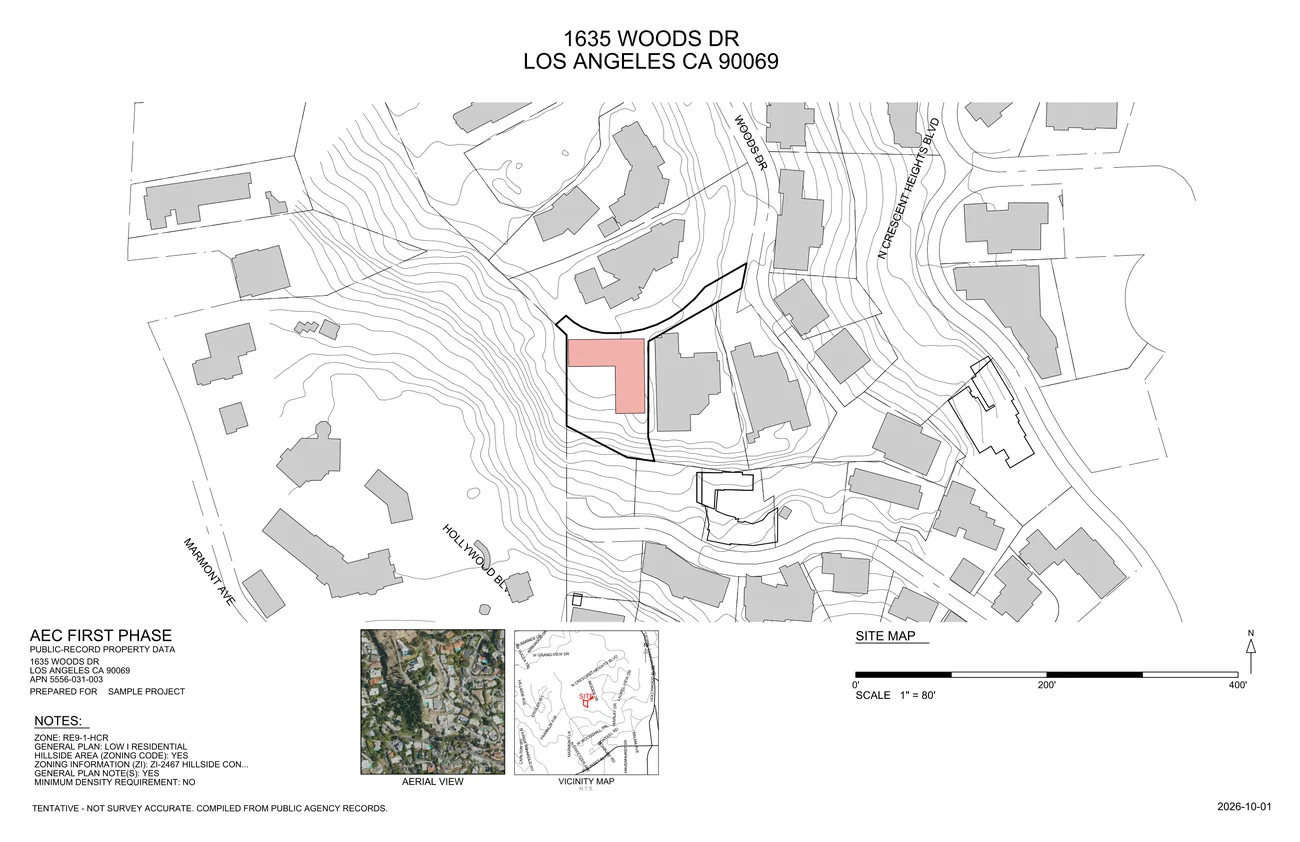
These are the 37 layers that hold something in the sample project’s drawing — 1635 Woods Dr, Los Angeles — with the color the drawing gives each one. A property outside the City of Los Angeles has no City layers, and a county that publishes no building footprints has none to draw.
| Layer | What it holds | Entities |
|---|---|---|
| The property and its neighbors | ||
| SUBJECT_PARCEL | The property’s outline, from the county’s parcel geometry. | 54 |
| LARIAC_PARCELS | The lot lines of the neighboring parcels. | 2,310 |
| LARIAC_BUILDINGS | Building footprints from the regional aerial survey. | 2,538 |
| LARIAC_ROADS | Street centerlines. | 268 |
| ROAD-NAMES | Street name labels. | 5 |
| ROW-SIDELINE | Right-of-way sidelines from the City’s map layers. | 364 |
| ZONING | The zone label, linked to the City’s zoning page for the lot. | 4 |
| Recorded surveys and maps | ||
| FOOTPRINT_RECORDS_OF_SURVEY | The outline of each record of survey on or near the lot. | 14 |
| REF_RECORDS_OF_SURVEY | A reference node per record of survey, hyperlinked to the document. | 28 |
| FOOTPRINT_TRACT_MAPS | The outline of each recorded tract map. | 22 |
| REF_TRACT_MAPS | A reference node per tract map, hyperlinked to the document. | 40 |
| REF_CORNER_RECORDS | Corner records at the monuments they describe, hyperlinked. | 48 |
| REF_CITY_CONTROL_POINTS | City survey control points, linked to their field-book pages. | 198 |
| Terrain | ||
| NOAA-CONT-1FT | 1-foot contours from lidar. | 603 |
| NOAA-CONT-INDEX | Index contours. | 73 |
| NOAA-SPOT-ELEV | Spot elevations. | 104 |
| CONTOURS_2FT | The county’s 2-foot contours for the wider area. | 103,809 |
| CONTOURS_10FT | The county’s 10-foot contours for the wider area. | 20,651 |
| SLOPE-10PCT | Where the ground steepens past a 10 percent slope. | 1,686 |
| SLOPE-15PCT | Where it steepens past 15 percent. | 1,330 |
| SLOPE-25PCT | Where it steepens past 25 percent. | 802 |
| SLOPE-50PCT | Where it steepens past 50 percent. | 824 |
| Easements and utilities | ||
| EASE-SEWER | Sewer easements from the City’s map layers. | 18 |
| UTIL-SEWER-MH | Sewer structures (maintenance holes). | 12 |
| UTIL-SEWER-LATERAL | Sewer laterals. | 8 |
| STORM-BASIN | Drainage basins. | 2 |
| Other City map layers | ||
| SPEC-HILLSIDE-ORD | The Hillside Ordinance area. | 2 |
| Image underlays | ||
| NOAA-AERIAL | The aerial photograph, placed on the drawing’s coordinates. | 1 |
| ASSESSOR-AERIAL | The assessor’s aerial of the lot. | 1 |
| ASSESSORS MAP | The assessor’s map page, placed as an image. | 2 |
| LOCATION MAP | The location map. | 2 |
| VICINITY MAP | The vicinity map the sheets print. | 2 |
| The drawing’s own notes | ||
| 00-TENTATIVE | The note the drawing carries: tentative, not survey grade. | 1 |
| 00-COMPILED-EXTENT | The extent the drawing was compiled for. | 3 |
| 00-INDEX-SHEET | The drawing’s index sheet. | 25 |
| 00-LAYER-CATALOG | The layer catalog: each layer’s data copied into its own labeled cell beside the map. | 638 |
| 00-CATALOG-NOTE | The catalog’s note. | 1 |
How to open it
Open the DXF in any CAD program or a free viewer (Autodesk Viewer online, DWG TrueView, LibreCAD) to measure and annotate. The record nodes are hyperlinks: in AutoCAD and most CAD programs, Ctrl+click one and the agency’s own copy of that record opens in your browser.
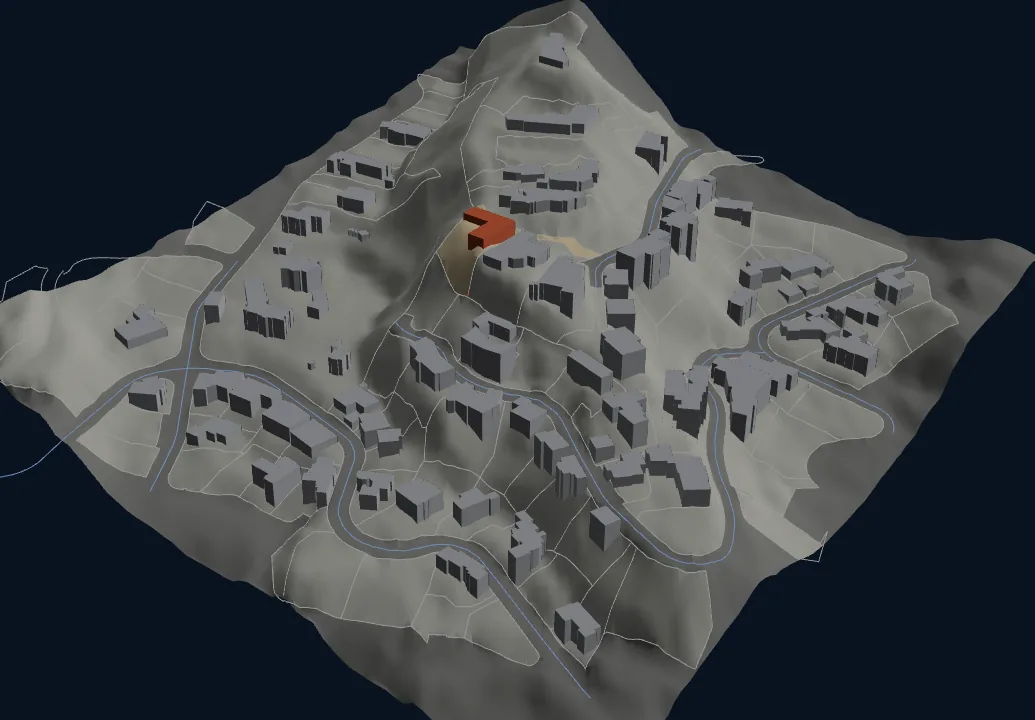
The package holds other drawings beside the compiled one: the terrain contours and the slope lines as their own DXFs, the City’s map layers as a DXF, the assessor’s base drawing, and the 3D massing model as OBJ and DXF.
Outside Los Angeles County
The same drawing is compiled in nine more California counties — Orange, Ventura, San Bernardino, Riverside, San Diego, Santa Barbara, San Luis Obispo, Kern and Imperial — from what each county publishes, on that county’s own State Plane zone. Where a county publishes no building footprints or no survey-record index, those layers are absent and the package says why.
What is collected, county by county
The sample is 1635 Woods Dr, Los Angeles, shown view-only. AEC First Phase is not affiliated with this property or its owners.
Start with an address.
Free to look with a free account · $5 to take it home · no card needed to run